My Red Bull Wololo Legacy dataviz
On spare time, I play Age of Empires 2 (the video game of my childhood). I also like to watch some tournaments with pro players. Recently, there was the biggest tournament of Age of Empires 2 organized by Red Bull: Red Bull Wololo Legacy. This tournament included a prize pool of $200,000! Not bad for a 25 years old game.
As you can see on my blog (also on Twitter and Reddit), I like to post data visualizations. Also, I integrated an association of data visualization (Toulouse dataviz). To improve myself on data visualization, why not merge theses two hobbies?
Here we are, in this post I will show all data visualization I have done for this Tournament. In this post, you have the enhanced ones (mostly aesthetic changes) compare to those I published on Twitter and Reddit. To make these graphs, I used data from Liquipedia, generated graphs with Plotly and refine them (with logos, backgrounds on figures…) using Inkscape. I have chosen to use the two main colors of the Red Bull logo for my creations, as at the time I was thinking it could be nice to make create some sort of series.
I am happy it worked out that well, so this post is the beginning of a series of post about dataviz for Age of Empires 2 tournaments!
Enough talk, let’s look at my work now 😃.
Players achievements
My first dataviz was to show the achievements of each player regarding their rank alongside the number of games they won, lost. It also includes the prize they gained. I am pretty happy with this one as it looks pleasant with multiple information on it.
![]()
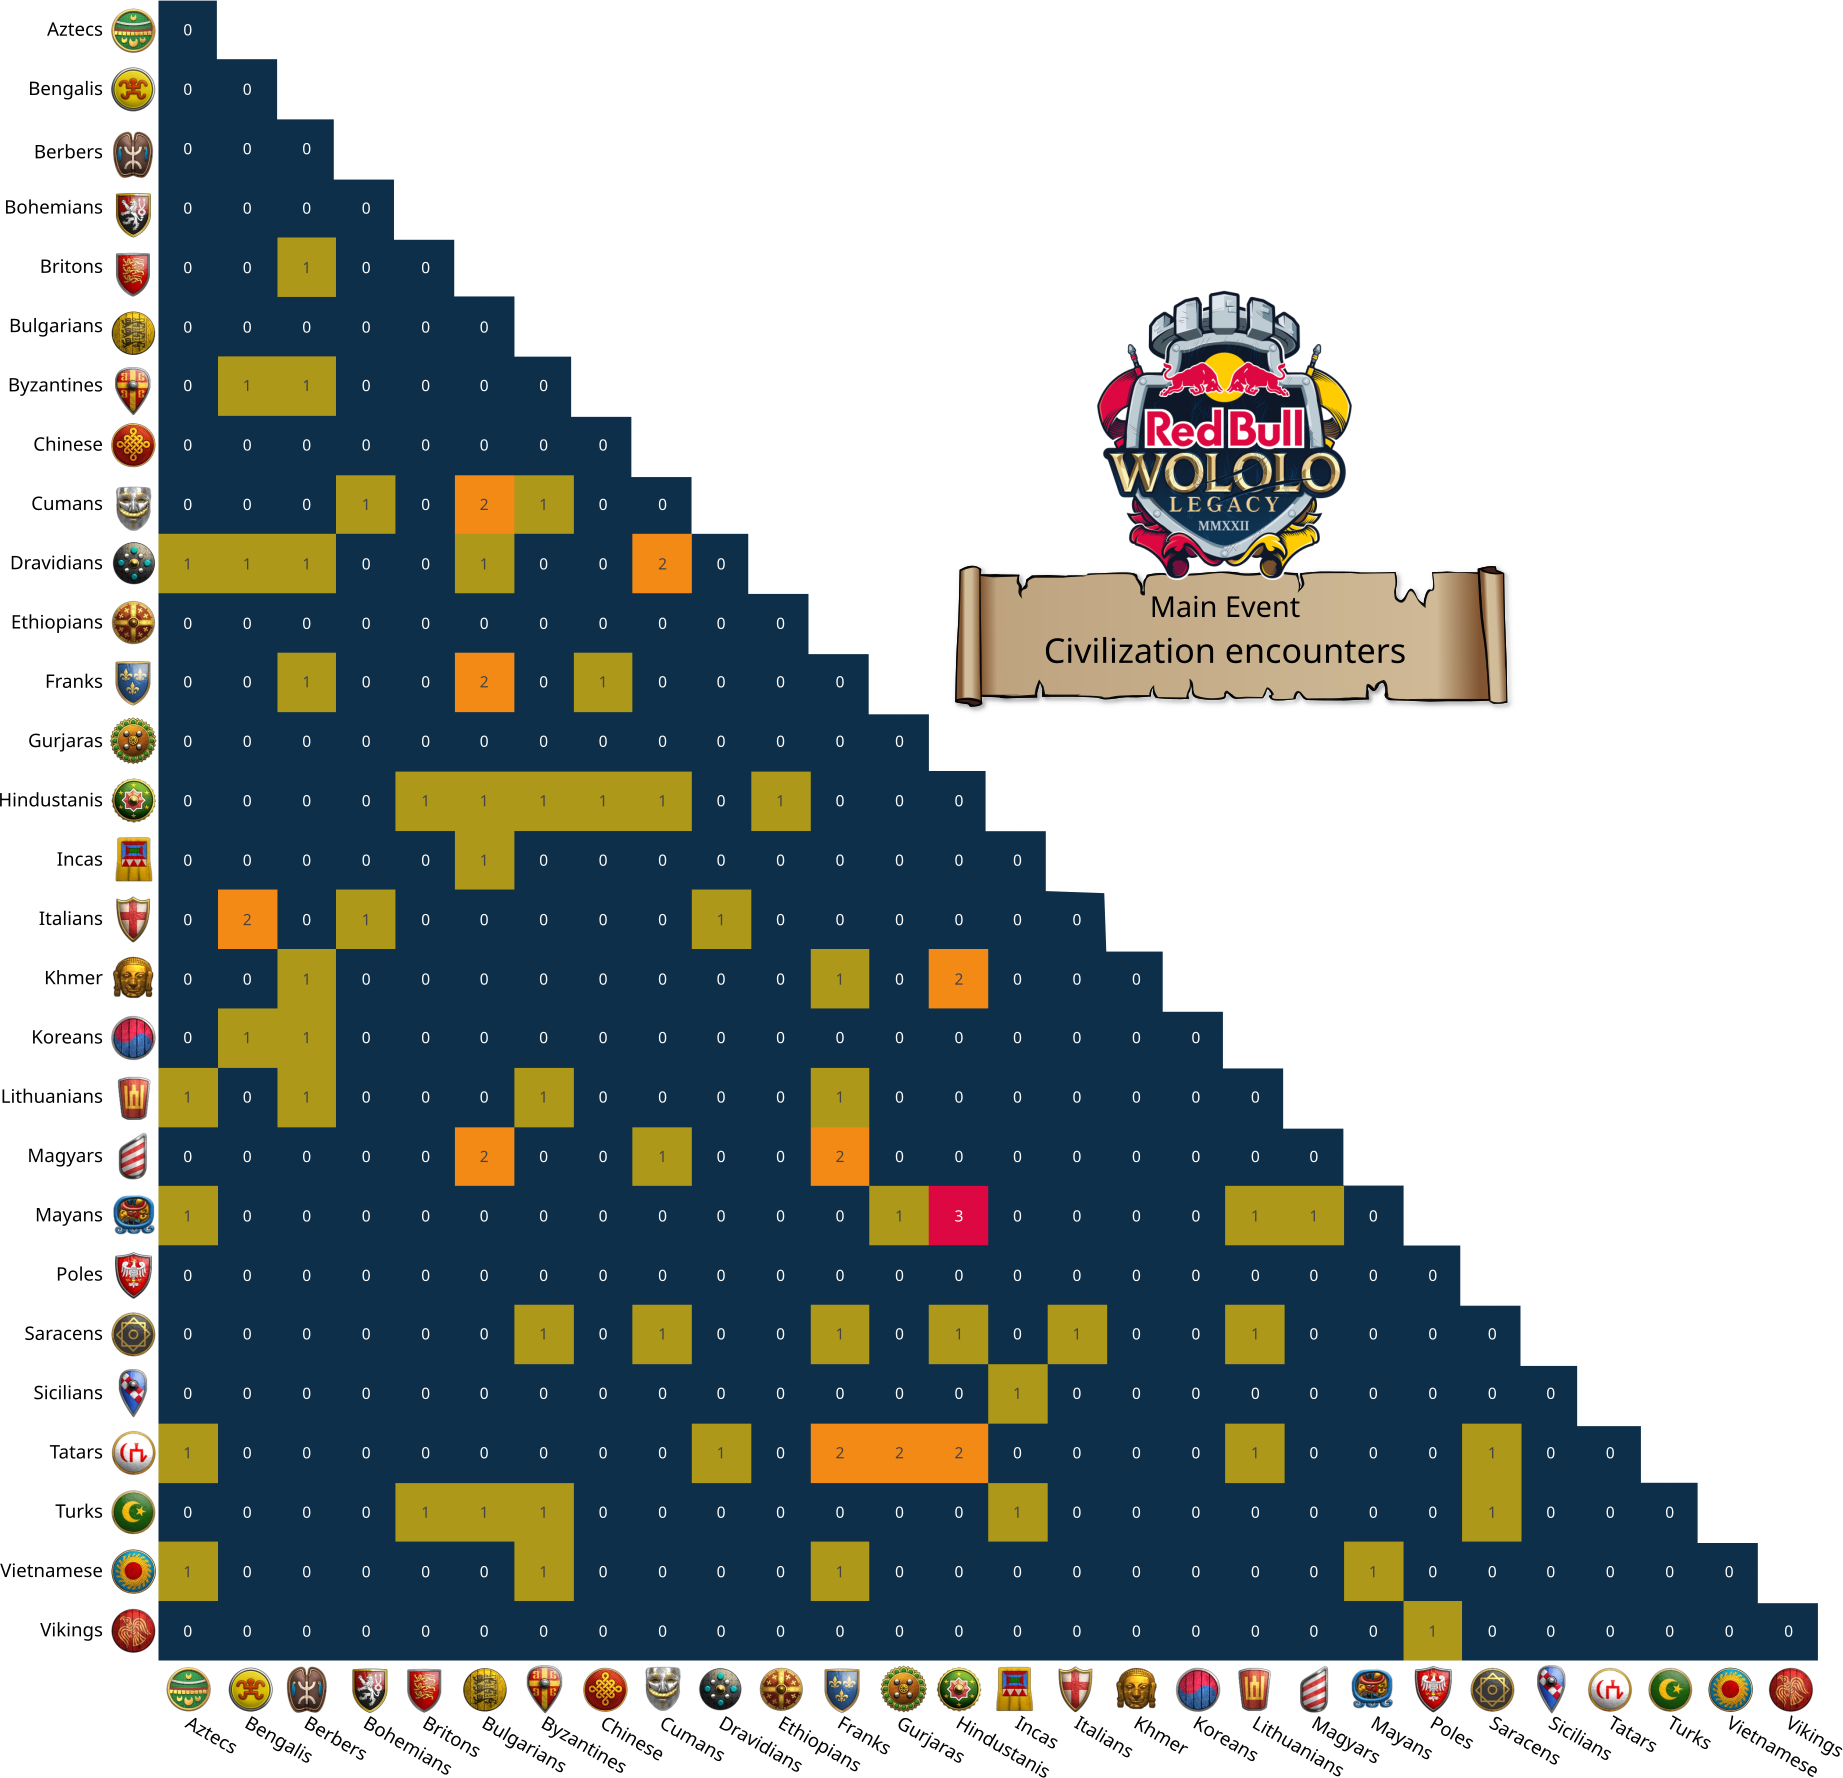
Civilizations matchups
Next, we have the dataviz with the most feedback (positive and negative ones). In this work, I created a confusion matrix and as they are symmetrical, I removed the redundancy (a habit as a machine learning guy 😅). I think the result looks pleasant, but I am not convinced of readability (I have a few comments on that point). As it required significant effort in Inkscape, I may not include this one (as is or at all) for future tournaments.
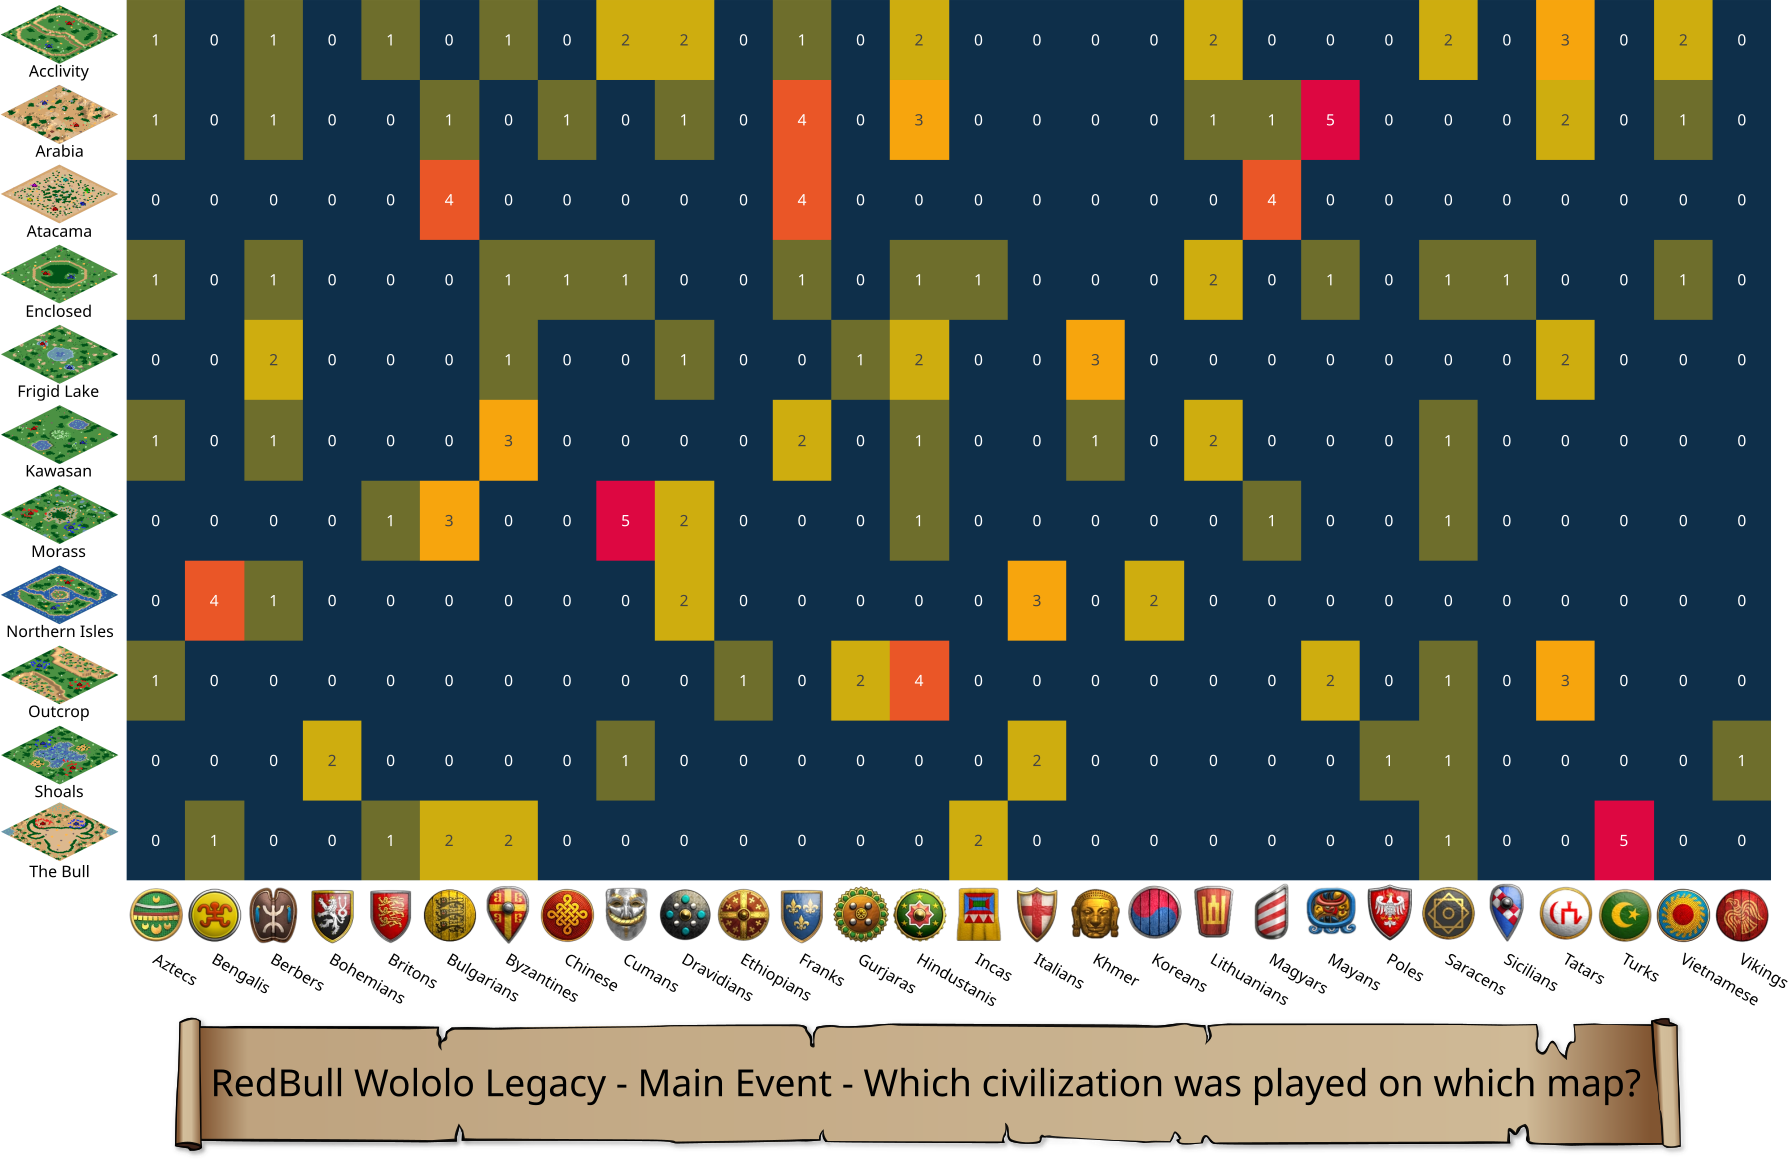
Which civilization was played on each map?
Next, we have a matrix of which civilization was played for each map. Simple and efficient, I like the content but not that pleased on the aesthetic. I will try to improve that for next tournaments.
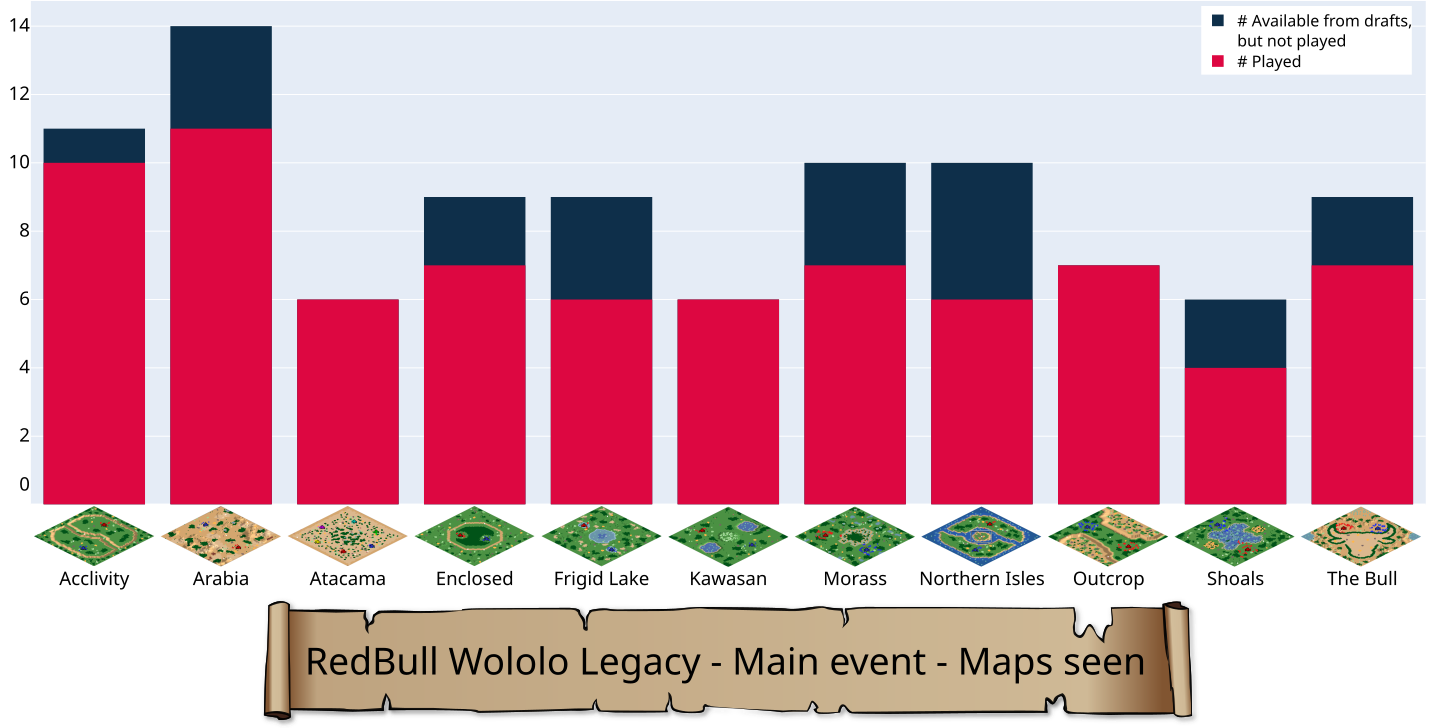
Which maps were popular?
This one got less attention from people, but as I like the info it gives, I will keep it and try to improve it for future tournaments.
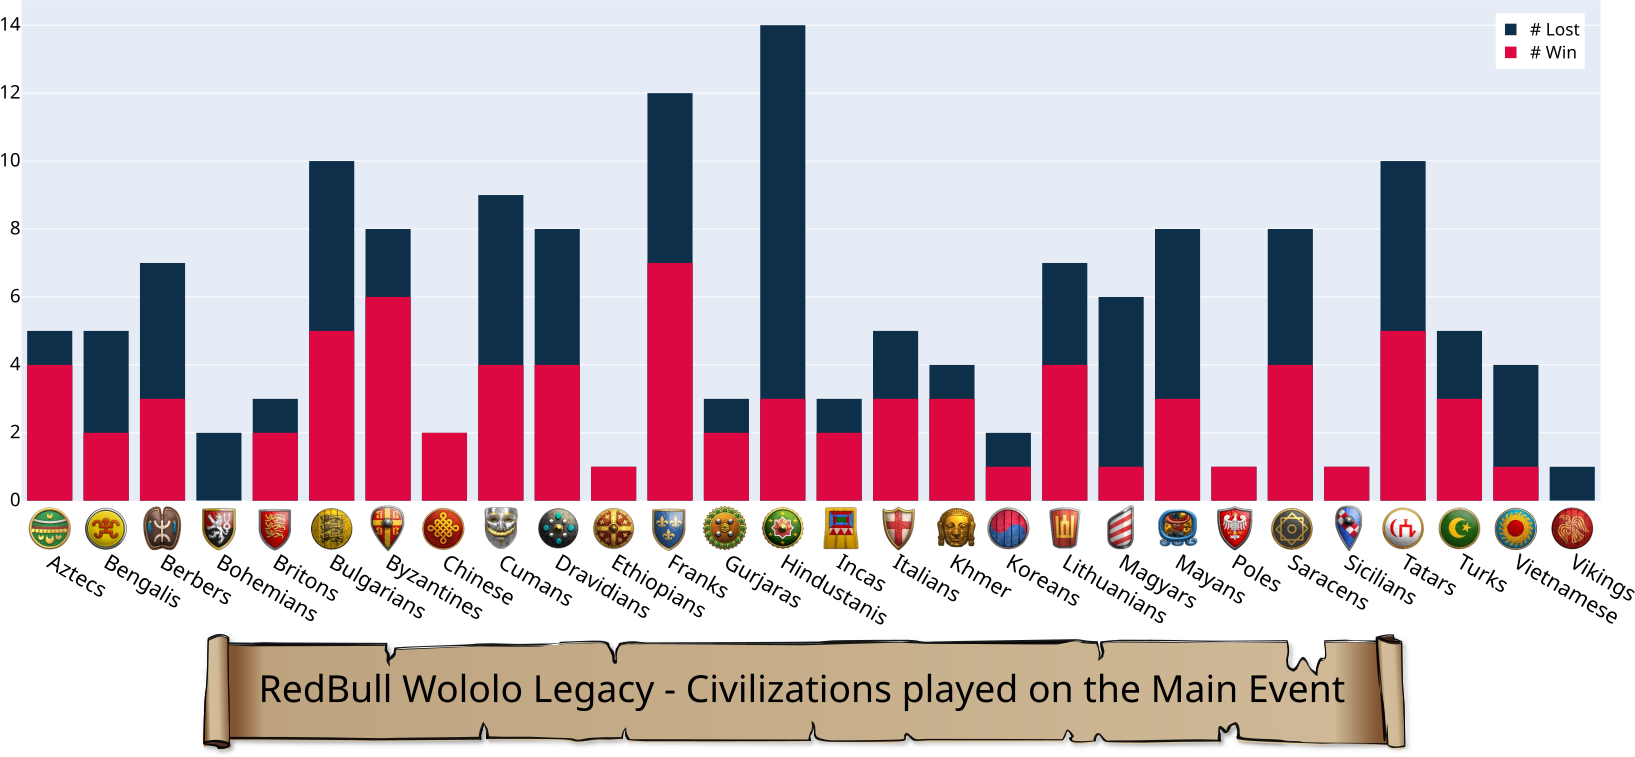
Kill/death ratio of each civilization played
One that created numerous discussions on strategies and civilizations balances. I love to discuss and see explanations from others, it helps me as a player, and it is always fun 😄.
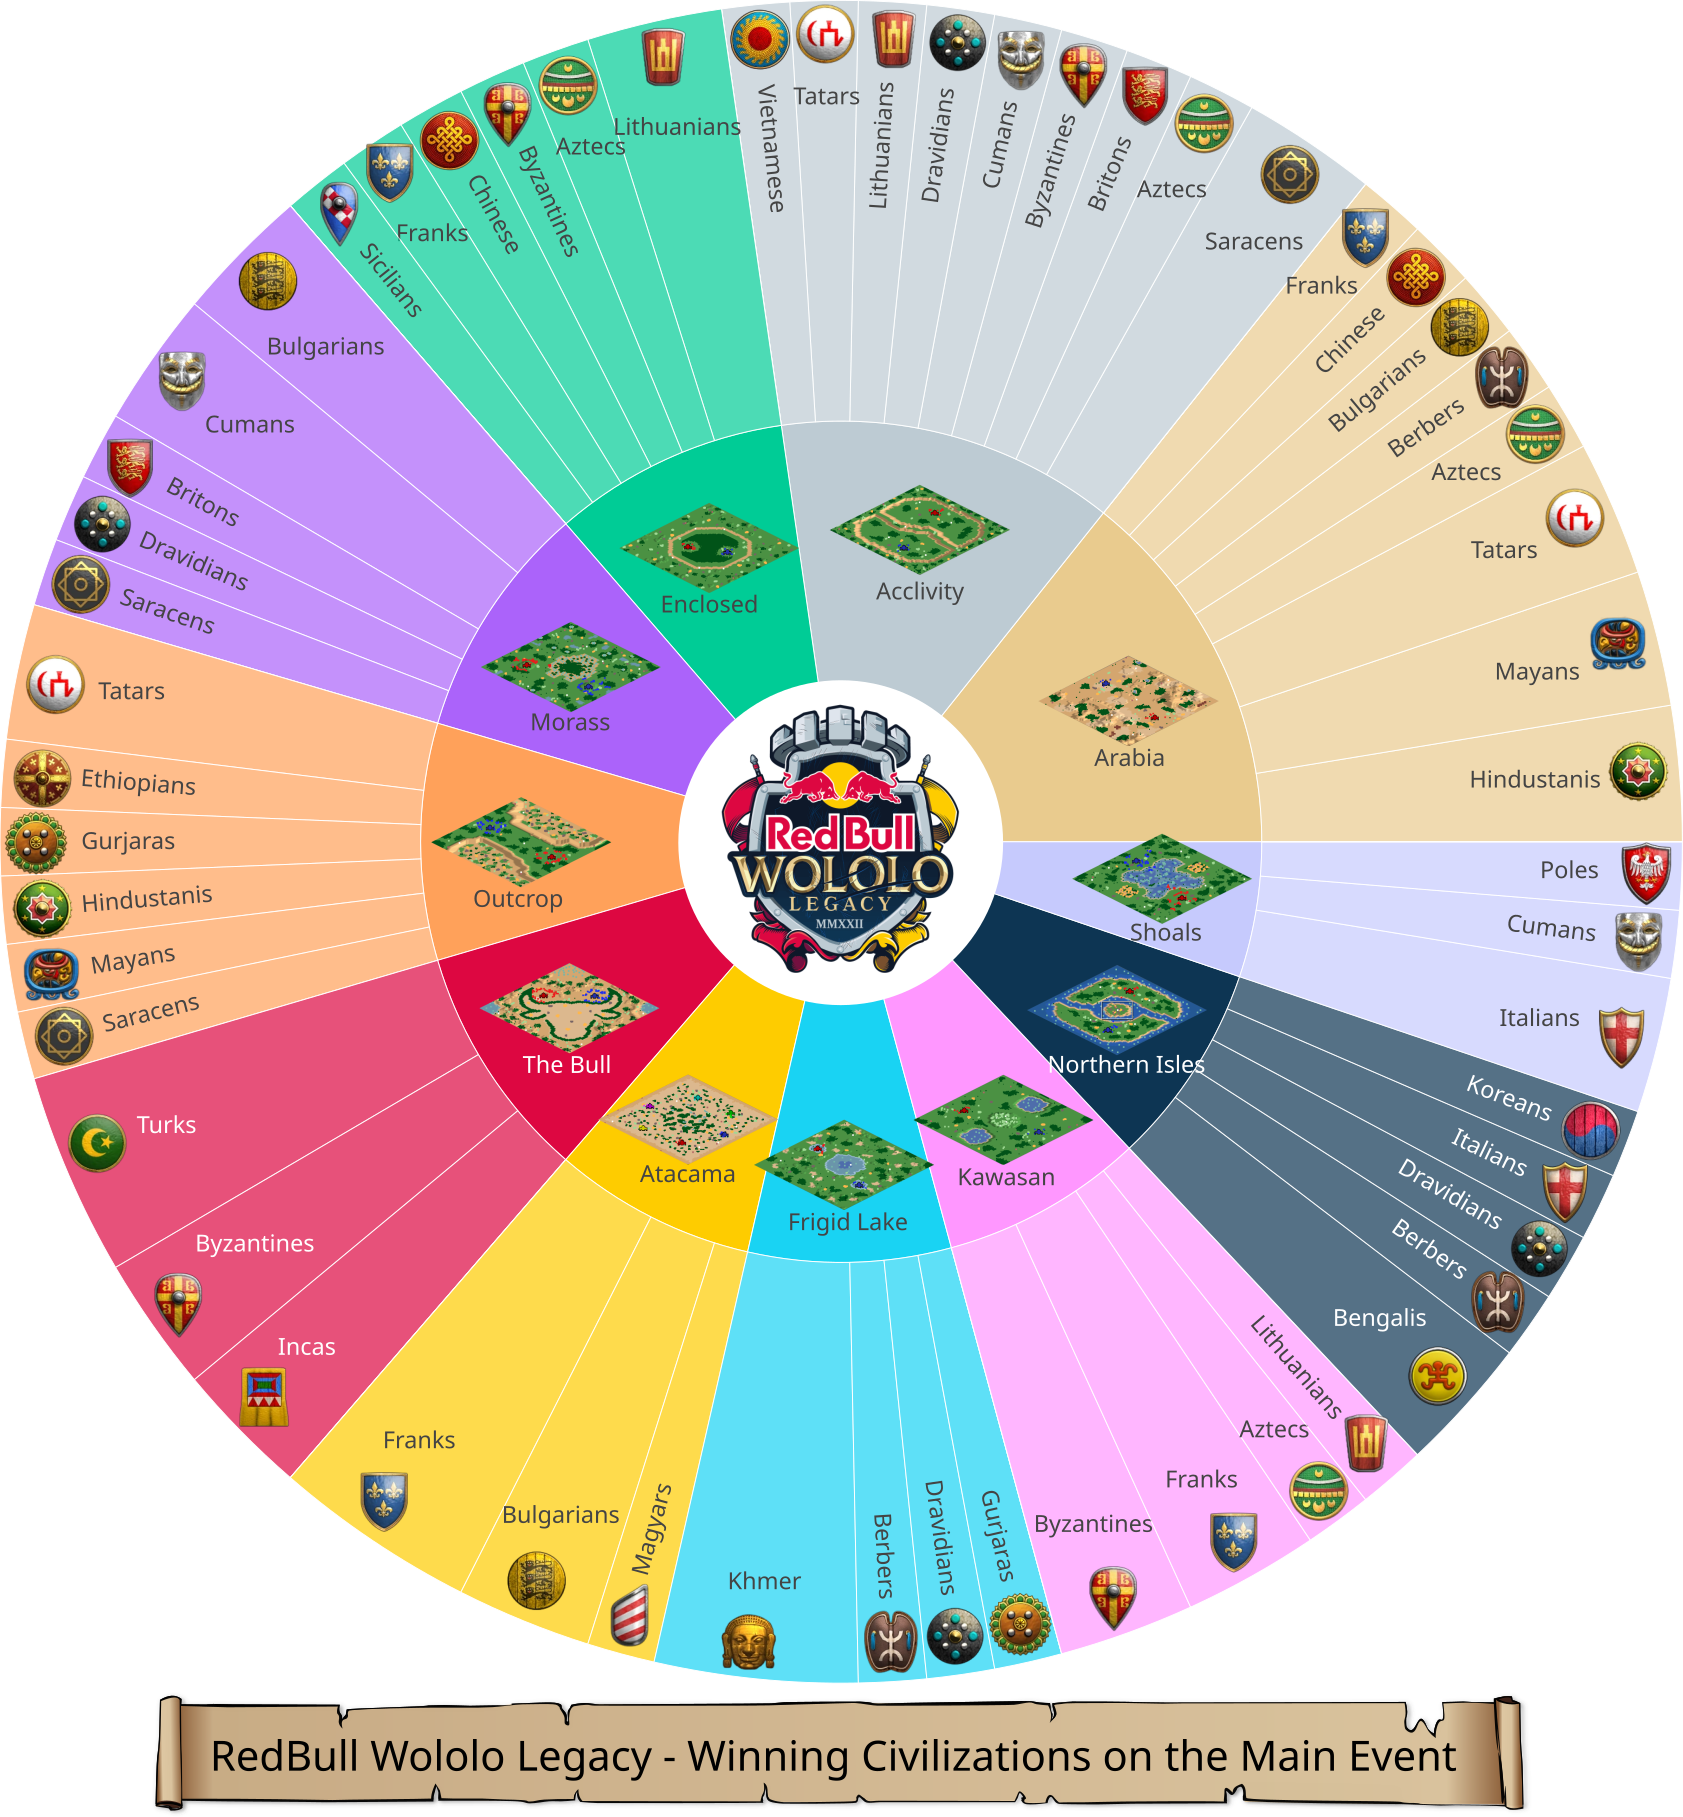
The wheel of victory
Finally, my last work, a wheel of the victorious civilizations on each map. I did it as a wheel to avoid the blanks from an equivalent using matrices. It resulted in an aesthetic (I am biased as I am pleased of the look) and informative creation. It includes the proportions of games on each map and proportions of civilization victory on each map.
This work will require work for next tournaments (to let people see numbers and not only proportions), but it was fun to make.
What is next?
For this event, I published on both Twitter and Reddit. My creations obtained more views and reactions on Reddit. For a comparison, my first visualization has been viewed 30 times on Twitter (with no interactions) and more than 35,000 on Reddit! On Reddit, those dataviz generated discussions about the tournament and I got feedbacks with good advices to improve my work (which will be seen for future tournaments).
If you did not see it yet, the next tournament I will cover will be Warlords.
I hope this will help and/or inspire some of you.
Cheers, Vincent.